Digital marketers are under tremendous pressure at the moment to produce results with their marketing budgets. Gone are the days where a business just threw money at something and no care about the result. Instead we are in a world where every campaign needs evaluating to understand how it is performed against other marketing channels.
The first part of this article will help you understand how ROI is calculated. Then the second part looks at how to predict traffic. The final part will bring everything together to understand how predict what ROI will be achieved as a result of implementing an SEO fix.
What Is ROI and How To Calculate It
ROI is a metric used to measure how much was gained vs what effort was put in. It’s a metric that highlights which campaigns have performed best. Marketing & Digital Marketing managers want to be about to know if they spend X, then how much are they going to get in return 2X, 3X.
The formula for ROI is simple:
- ROI = (Increase from Campaign – Cost of the Campaign) / Cost of Campaign
- (£72,000 – £5,000) / £5,000 = £13.4
This means that for every £1 spent the client has earned £13.40.
How to Work Out ROI for Non-Transactional Websites
While working out the ROI of a website that sells online is reasonably simple to work out, doing the same for a website that relies on advertising revenue is difficult because we need to carry out a few calculations to use the ROI formula.
For example, if we were working on a campaign for an online magazine, which costs £2700 per month and this months, year on year there had an extra 89,122 sessions what’s the ROI?
What we need to do is first work out the revenue earnt. We use the CPM price which stands for Cost Per Thousand which is a marketing term used to denote the price of 1,000 advertisement impressions on one webpage.
In this example, we will assume that the site earns on average £35 per CPM with 3 different ads running on each page means that the revenue is around: £105 per CPM.
So now we have our CPM price we need to work out how many impressions or more commonly known as pageviews we have had. To do this we use the following formula:
- (Sessions x Avg Pageviews Per Session) = Pageview
So, in our working example:
- (89,122 x 1.55) = 138,139 pageviews
Now we understand how many pageviews we have achieved we can work out the amount of revenue using our CPM:
- 1,381 x £105 = £145,005
So now we have the total revenue finger we can now using the formula to work out the ROI:
- ROI = (Increase from Campaign – Cost of the Campaign) / Cost of Campaign
- (£145,005 – £2,700) / £2,700 = £52.70
Which means for every £1 spent we earn an additional £52.70.
It’s worth considering that this calculation presumes that all the advertising slots are sold and it also doesn’t consider bulk purchase deals which is often happens with buying media placements.
Our data is only an example of how the calculation work however the more arcuate the data the more accurate the result.
Working Out Traffic Predictions
It’s now for the second part which is how to make traffic predictions. Now like any form of prediction it is just a prediction which means its highly likely to be wrong. However, the more predictions you make the better you will get. However, we are going to show you some quick technics to make sure you are as accurate as possible.
The first part of any traffic prediction is understanding where traffic will be heading in the next 12 months if you did nothing, i.e. natural growth.
Now there is so many days to do this, however I will share you just one way I do it, however you are free do use your own method.
To predict future traffic, I go to Google Analytics and I click on Acquisition > Campaigns > Organic Keywords.
Then change the date to display data for the last 18 months. Make sure you set the graph to display the metrics in months and not daily as it is set to by default. Export that xlsx file and open it up in excel. Once open select the third tab called “Dataset2” and carry out the following instructions.
In the first column lists the month and in the second column lists the amount of sessions.
The first thing we are going to work out is the month on month percentage increase. We can do this by selecting cell C3 and typing the following formula:
- =(B3-B2)/B2
Then set the cell formatting to Percentage and we have now just worked out the month on month percentage increase, YAY.
If you pull that formula down it will then work it down for all months.
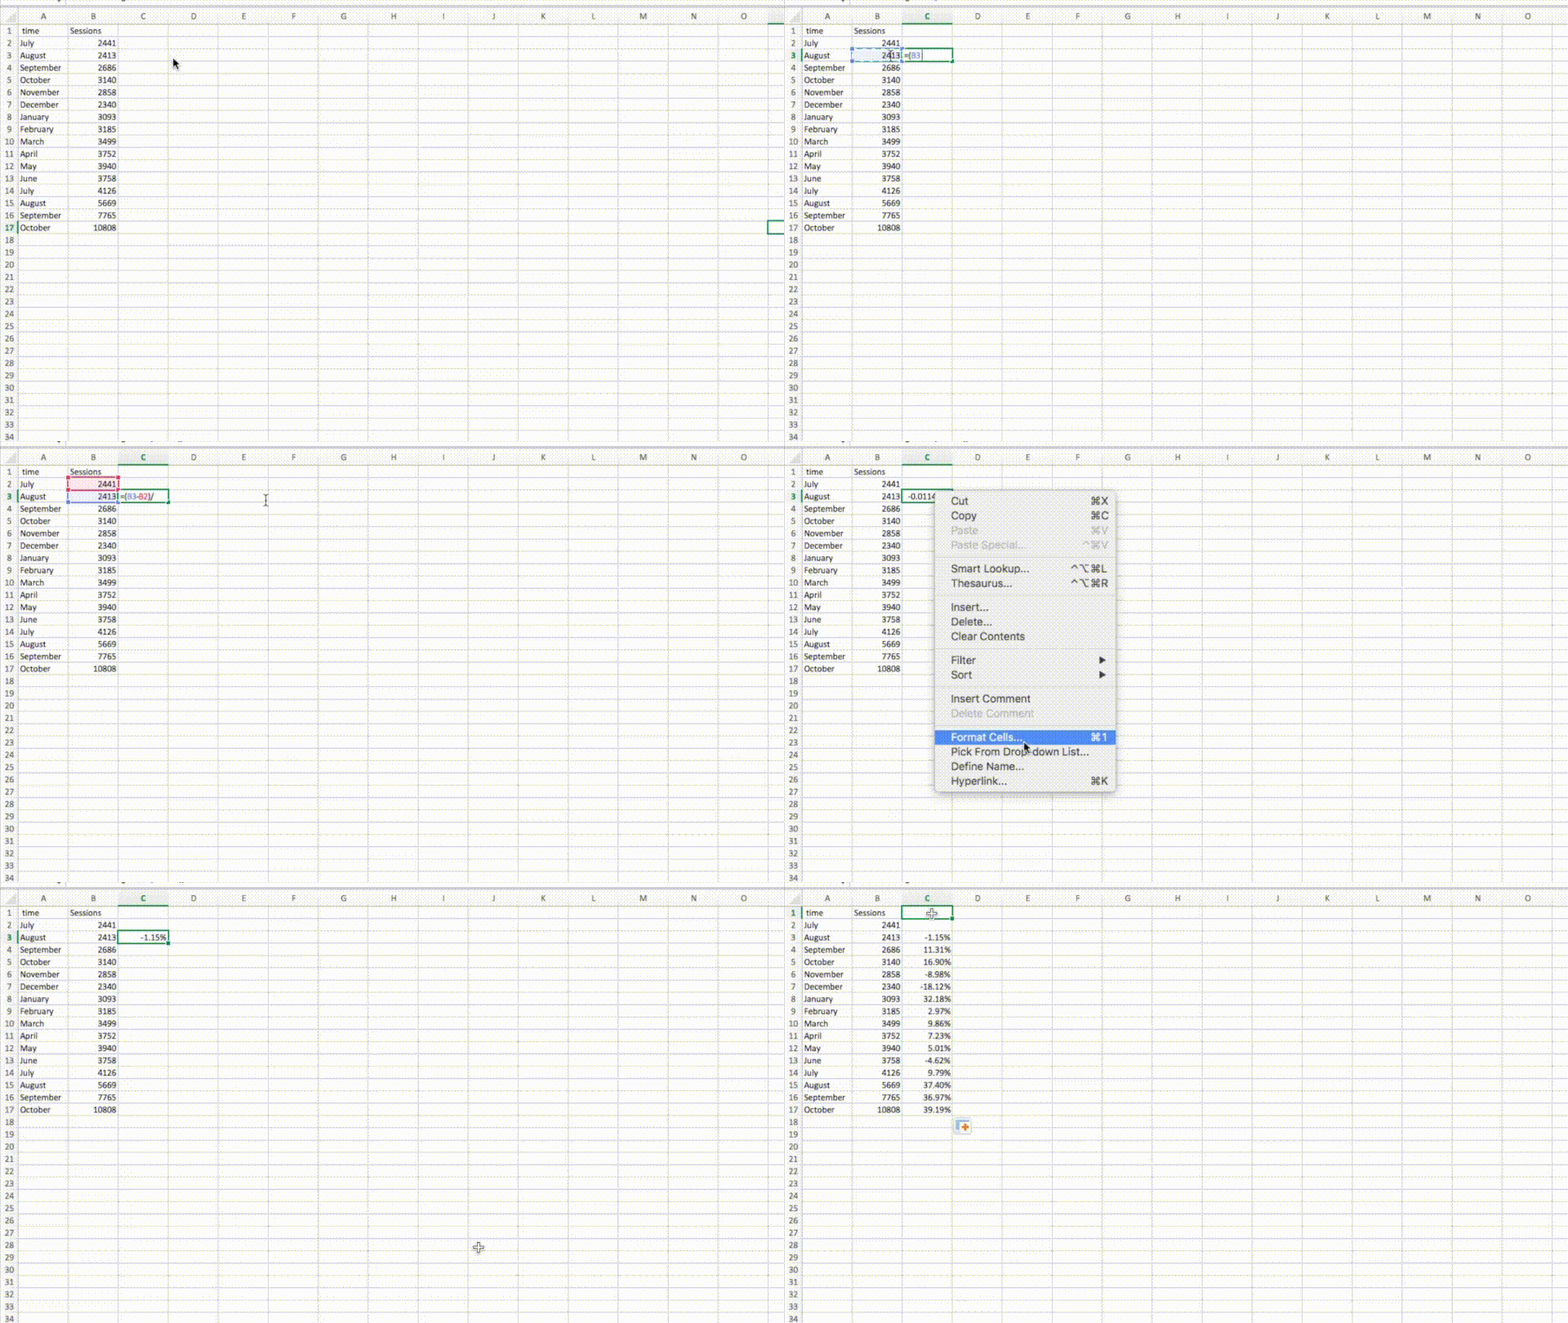
Next click in cell C1 and type the following:
- =MEDIAN(C3:C17)
Which this will work out the median of all the month on month percentage increase.

Next we will move down to work out the year on year percentage increase using the small amount of year on year data we have. (If you do have access to more than 18 months’ worth of data then that will allow for more accurate.)
Now select cell D14 and type the following formula:
- =(B14-B2)/B2
This will work out the year on year percentage increase. Now pull that formula down in the same way as month on month.
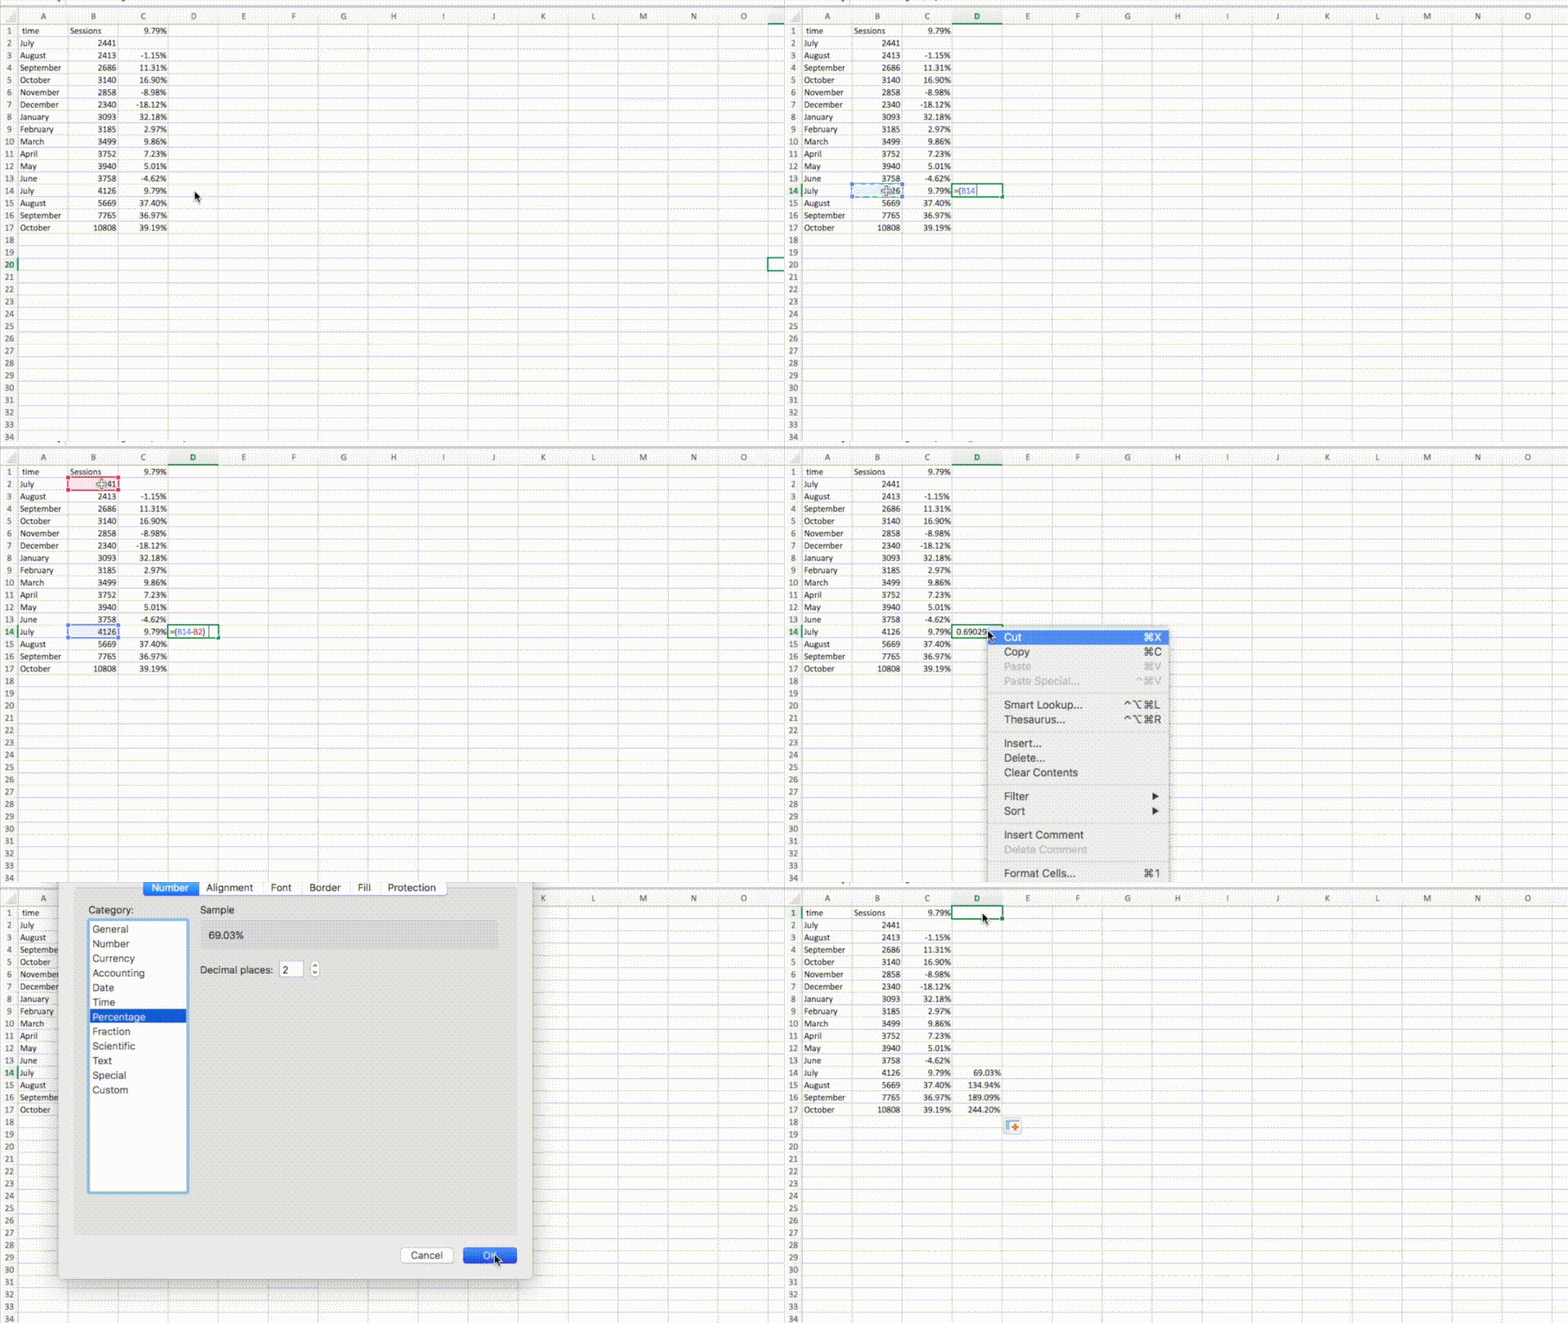
Then we need to work out the Median with the following formula:
- =MEDIAN(D14:D17)

So to recap where we are:
We have an excel spreadsheet with 18 months’ worth of sessions data. We have worked out what each month on month percentage increase is. Then we worked out what a few of the year on year figures look like. Finally, we have worked out what the Median figure is for both, month on month and, year on year figures.
Now what we need to do is take these new figures and apply them to past figures to then project over the next coming 6 months.
Now we need to apply the month on month Median to the final month’s data to see what next predicted month will be. So type in the following formula:
- =(C17*C1)+B17
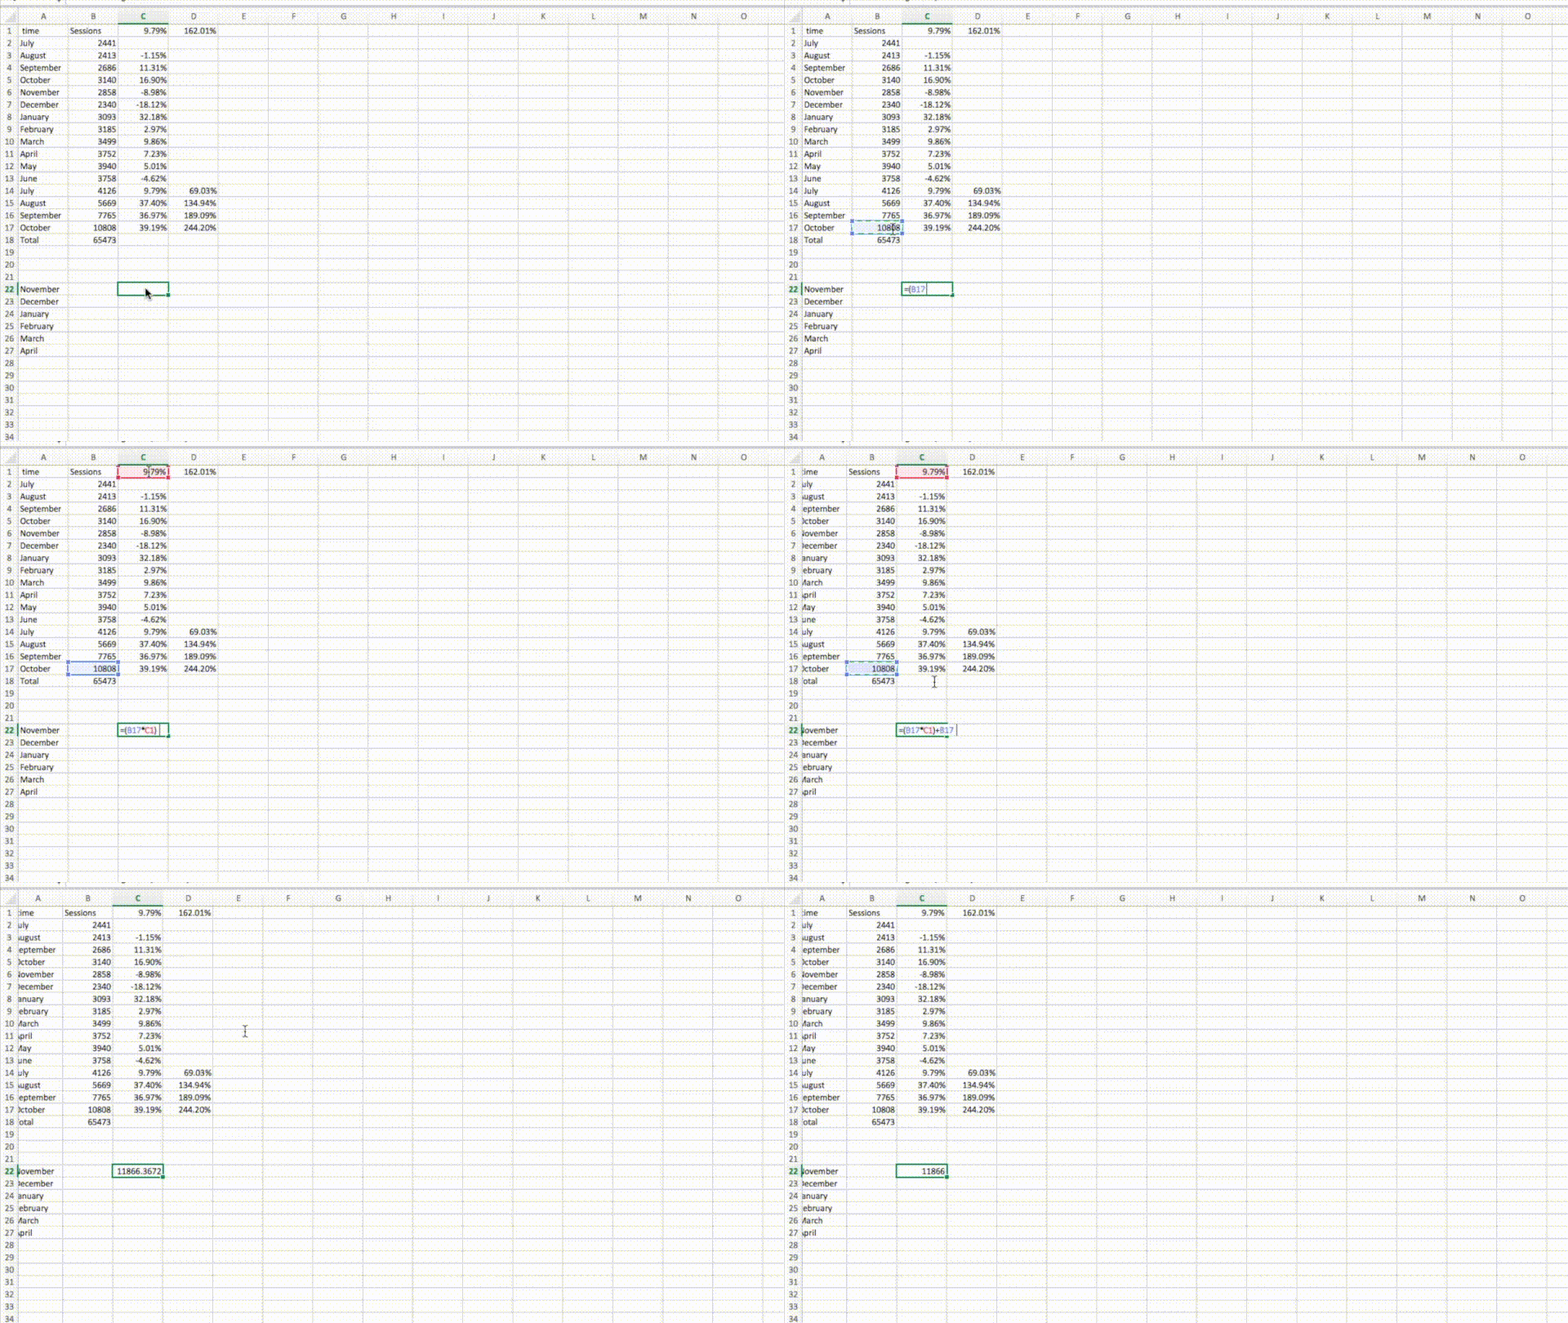
This will give the first months projected traffic using the month on month increase. From that figure we can apply the median average increase in C23:
- =(C22*C1)+C22
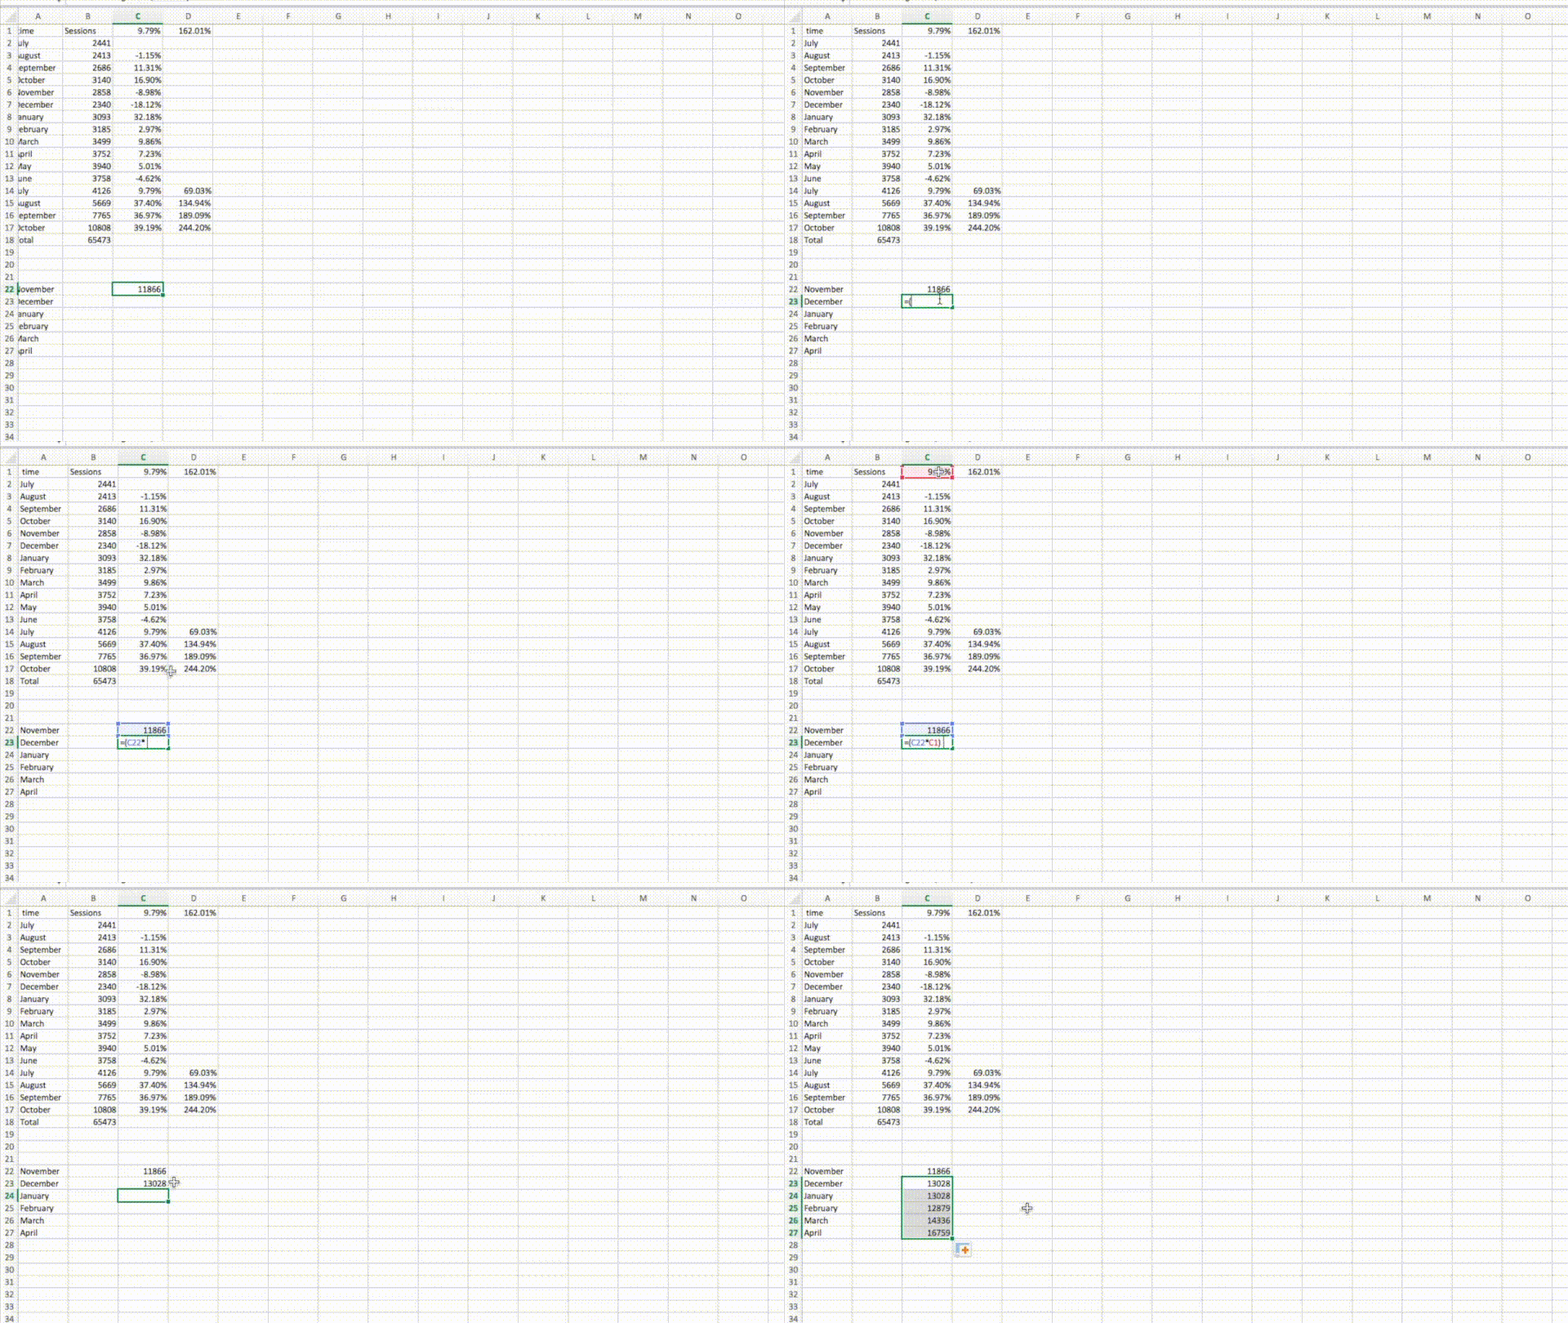
Then for C24 to C27 we can pull down the formula. We now have a completed 6 month prediction based upon month on month growth of 9.79% which was the median growth rate for the previous 18 months.
Next we need to work predicted growth based upon year on year median of 162.01%.
To do this go to D22 and type the following Formula:
- =(B6*$D$1)+B6
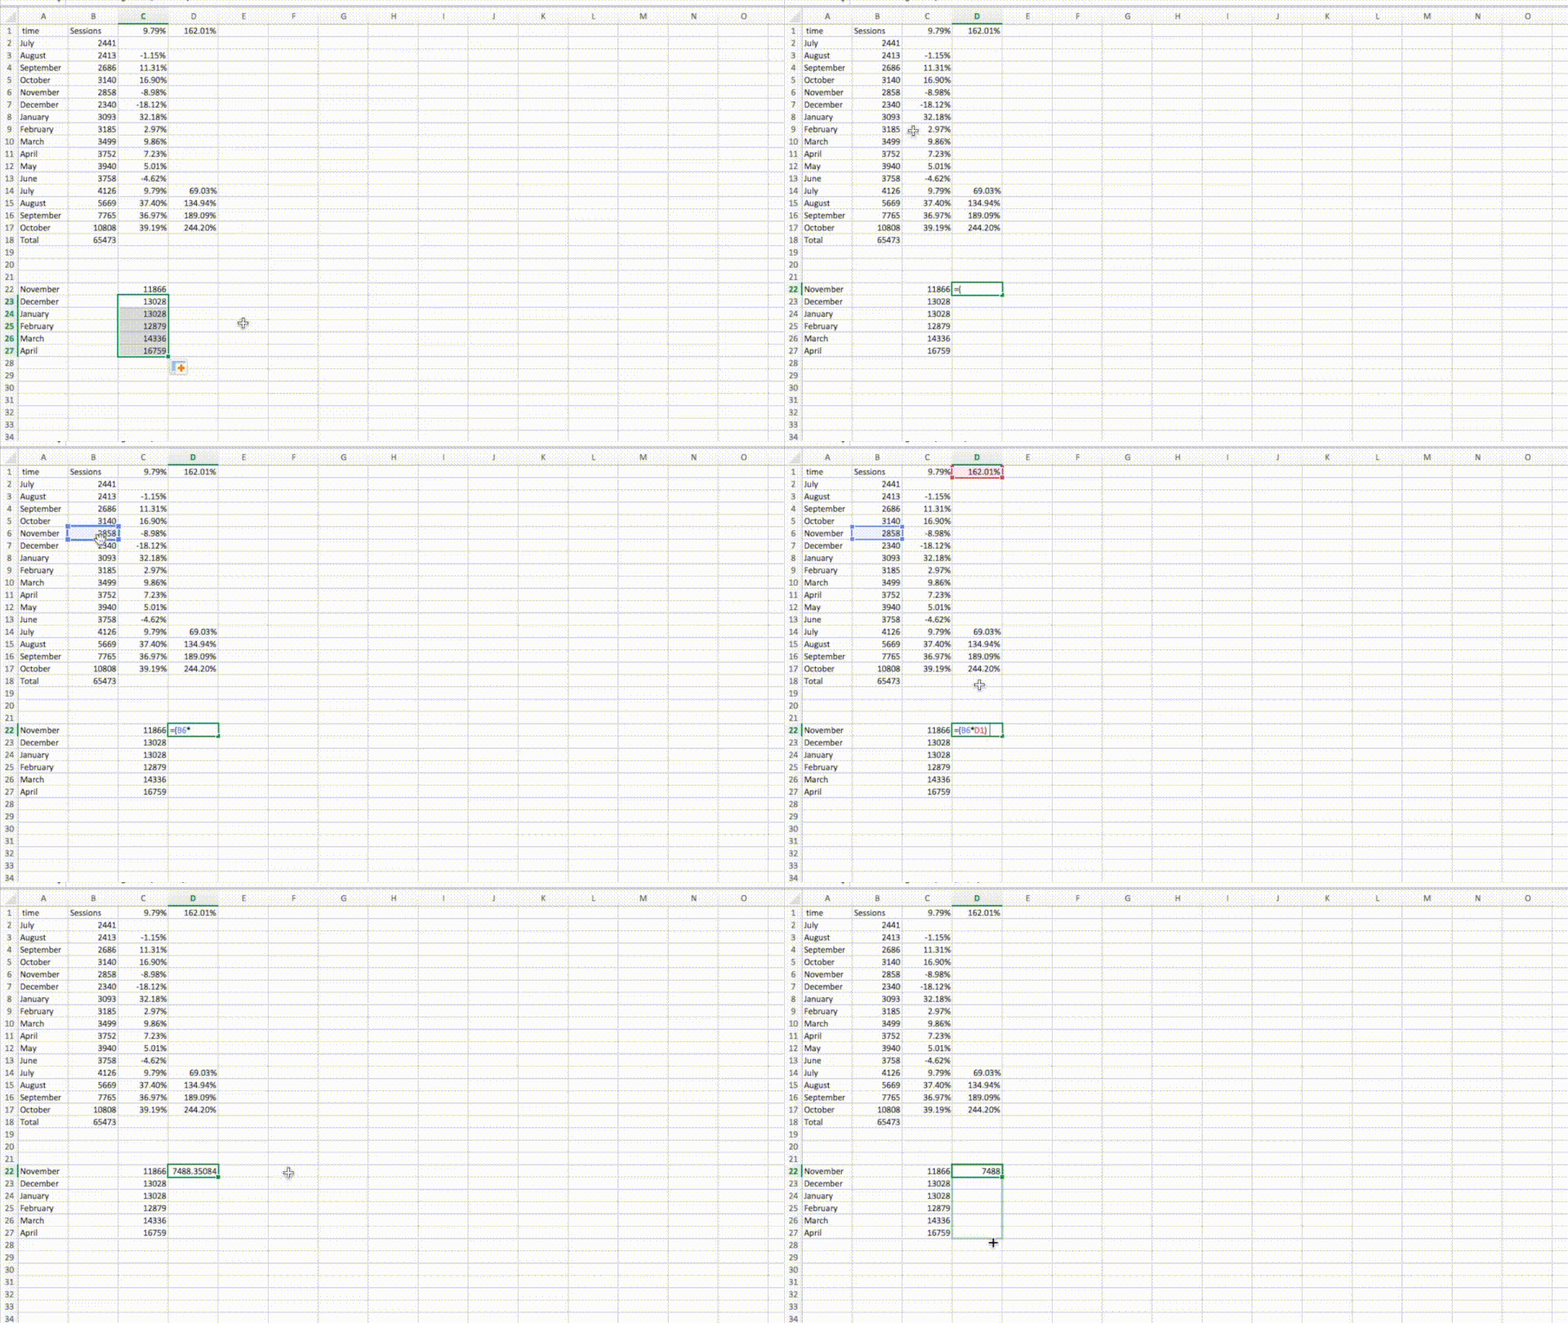
The above formula takes the figures for November last year and adds 161.01% on top giving us a predicted figure for November data.
As with the month on month predications we can pull down the formula down. Now we have traffic predictions based upon year on year medium growth.
So now we’re left with two sets of traffic predictions. One based upon month on month growth and the other based upon year on year growth.
The final thing we need to do in B22 is to take the Median of both months on month and year on year to find the middle ground by doing the following formula:
- =MEDIAN(C22:D22)

Once again we can pull this formula down now for the following 5 months and that is now our traffic predictions for the coming 6 months. They should look something like the following:
- November: 9677
- December: 9580
- January: 11204
- February: 12025
- March: 13205
- April: 14381
Now we have successfully come up with some kind of traffic prediction that allows us to see potentially how much traffic we expect to see in the coming months providing we continue to see the same level of growth.
Keep Examples of other success
So we now understand what ROI is and how it is calculated. We also have learnt to make traffic predictions based upon consistent historical growth.
Next we need to understand how our recommended fixes with impact on future growth. This is probably the hardest part of the process is predicting how much more traffic you expect to gain as a result of implementing a fix.
One of the most arcuate ways of predicting impact is using past examples of successes whether that be for your own client or it is with third party sites. These come in handy when talking with stakeholders of what the expected outcome. They can be used to encourage others to support your recommendations. They can also work the other way as a way to discourage and idea.
All you need to do is take screenshots of Sistrix of what happens when X website does some large change like move a site from sub domain to sub directory. You can keep them in a folder, Dropbox or even on twitter if it makes sense. Try to keep the stuff organised because looking for a particular screenshot months or sometimes years afterwards can be difficult to find. Also, we would recommend recording the date in the title because then you know how to find the issues again.


The two key things to take from the entire exercise is these are proven examples, which always have more weight Plus they give you some kind of expectation should you implement the same test.
Keeping an example of changes achieves two things. First of all, its evidence to your stakeholders that it works and the second thing it does is gives you an accurate prediction.
Running Tests
Sometimes when you are making traffic predictions you do not have an example to hand. In which case we would recommend running a test.
What we mean by running a test, is taking a recommendation for example reducing the size of a header image and instead of just implementing it, just taking a couple of pages and running a test instead of applying the fix to all 250 product pages.
By running a test on a couple of pages we should be able to see the impact we will bring. For email after a month of running the image size test we can see that the two pages in a test have increase traffic by 11%. So in theory had we applied the test to the entire site we would expect to see a growth by 11% of traffic.
How to apply predictions to SEO fixes?
So to recap we have predicted traffic for the last 6 months based upon historical growth figures. We then have run a small test on a couple of service pages that saw an 11% growth in organic traffic to the service pages.
So now we have a 6 months of traffic prediction. So now we need to add another line of data that suggests what happens if we implement a fix.
An example of this might be that by adding a xml sitemap to a site increased organic which we expected to see a 10% uplift in traffic.
Now this fix will be implemented in February so we can now create a new graph that shows current predicted levels as well as how we feel the fix will impact on traffic.
Now you can see by the above graph we have two sets of data. The first in blue outlines what traffic we predict we will see at current growth levels. The orange line is the same traffic prediction however it also includes the impact that we expect to see when implementing a fix.
Not only does it allow us to clearly see how much extra traffic we are likely to see, it also shares the importance of implementing fixes sooner to gain maximum benefit.
Working out traffic predictions to SEO Fixes
So now we have traffic predictions for the next 6 months and we have traffic predictions for the amount of extra visitors we will receive as a result of our fixes we are now in a position on how much ROI that increase will bring us.
So the client that we did a traffic prediction is currently paying £5000 per month. To work out their ROI for the last months to do the following sums.
Now let’s work out what the ROI will be for our predicted 6 month’s worth of traffic. Then we can work how the ROI improves based upon out recommended fix.
Now for the purposes of these calculations we can tell you that the clients conversion rate is 2.89% along with an average order value of £50.
Now we need to find the correct figures to work out the following formula that was at the stop of the article:
- ROI = (Increase from Campaign – Cost of the Campaign) / Cost of Campaign
Now the client was spending £3,000 a month so we know that the cost of the campaign over the 6 month period was £18,000.
Next what we need to work out is how much traffic did prediction say it would achieve.
Traffic Predictions with fix for next 6 months: 70,073 sessions
The we need to remove last year’s traffic: 18727 sessions.
So we now need to work out how much extra traffic they have received:
- 70,073 – 18,727 = 51,346 Sessions
Next we need to times the amount of sessions by out conversation rate to understand how any sales were achieved extra
- 51,346 * 0.0298 = 1484 sales
Now with an average order value of £50
- £50 * 1484 = £74,194
Which means we can now calculate ROI:
- (£74,194 – £18,000) / £18,000 = £3.12
Which means for every £1 spent the client earned back £3.12
What is also useful is working how much additional revenue our fix will bring in.
To do this you need to so the same calculations as above but with the traffic predictions data that include the fix traffic data.
- 74,430 – 18,727 = 55,703 Sessions
- 55,703 * 0.0298 = 1610 sales
- £50 * 1610 = £80,491
So from the above calculations we can work out the ROI of the traffic predictions which include the improvements from our fix.
- (£80,491 – £18,000) / £18,000 = £3.47
What is interesting is now we have these two sets of numbers we can say that if the client implements the recommended fix we predict that for three months after implementing the fix the site will earn an extra £6296 in revenue.
I believe any digital marketing manager will see how powerful this math is.
Being able to predict that revenue that could be returned will help on some many levels. For a target, it can highlight how you are going to hit revenue figures. The second thing is it allows developers time to understand if implementing a fix would take too long.
For example, we have predicted that implementing a fix will bring in an extra £6296 in revenue which sounds great however if the if the fix costs £7,000 to implement then it wouldn’t produce a positive return on investment.
Summary
Working out potential return on investments allows managers make better decisions by providing them with factual figures that give greater understanding of the risks and rewards.
With these predictions, you must bear in mind that these are just that… predictions and 9 times out of 10 they are going to be off or sometimes wrong altogether. The difference is its far easier to make decisions when you are presented with data compared to no data at all.
These figures are also useful to use when deciding on if an issue is cost effective to fix. For example, let’s say we believe that if a client implements an SEO fix and thus the client expects to see a £3000 uplift in revenue. However, if it costs £4000 to implement then it doesn’t provide a positive return on investment meaning it’s not worth doing.
Plus, the more time you spend predicting your sites traffic the better you will become which will then improve your success rate overall.
Richard Petersen is Search & data manager at Zazzle Media and a contributor to Search Engine Watch
source https://searchenginewatch.com/2016/12/16/how-to-predict-roi-for-seo-fixes/
No comments:
Post a Comment